
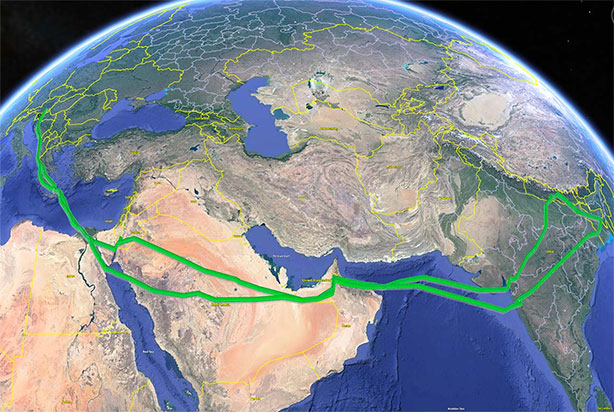
GLWF 2023 - Middle East, India, Himalaya
Himalaya glaciers are the source of drinking water for two billion people in the Indian subcontinent. The GLWF 2023 mission will look for evidence on the impact of black carbon transport on accelerated glacier melting.
Global warming is affecting the Himalayan glaciers as well. If the trend continues, the most pessimistic scenarios forecast their disappearance within the next hundred years. Their disappearance will trigger the demise of civilization on the Indian sub-continent, as all great rivers’ headwaters are in the Himalayas. The annual monsoon season, which is the result of complex atmospheric events, heating of the Indian Ocean and the Andaman Sea, Indian sub-continent, strong jet streams above the Himalayas, the Chinese Sea influence and the summer heating of the Tibetan High Plateau bring an extensive precipitation of snow to the mountain range, but also polluted air with a high share of black carbon. These particulates cover snow and ice areas and accelerate melting.
Flight data:
- Date: April 1st 2023 to April 21st 2023
- Distance: 20 000 km / 10 799 nm
- Flight time: 90 h
- Flying through: 12 countries
- Average flight altitude: 3000 m / 9900 ft
We started and finished the 2023 measurement campaign at the airport in Slovenske Konjice.
Landings for refueling and organization of further flight:
- Heraklion in Crete / Greece Hurghada / Egypt
- Al Ain / United Arab Emirates Mumbai / India
- Dhaka / Bangladesh
- Lumbini / Nepal
- Surat / India
- Al Ain / United Arab Emirates Aqaba / Jordan
- Heraklion in Crete / Greece
JATAC 2022 - Cape Verde
jatac2022.worldgreenflight.com
Flight data:
- Date: September 6th 2022 to September 21st 2022
- Distance: 14 200 km / 7 667nm
- Flights: 14
- Average ground speed: 212 km / h / 114 kts
- Average flight altitude: 2,000 m / 6560 ft
- Maximum flight altitude: 3800 m / 12500 ft
- Average fuel consumption: 19 liters / h
- The longest flight: 3020 km / 1631 nm
- Total flight over the ocean: 13,000 km / 7019nm
- Fuel Type: Mogas 95, Avgas 100LL
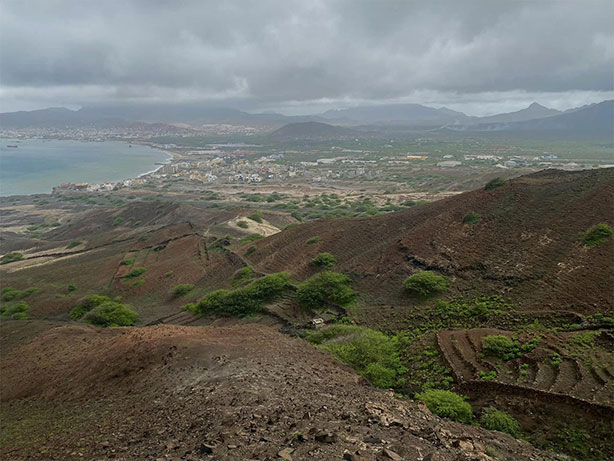
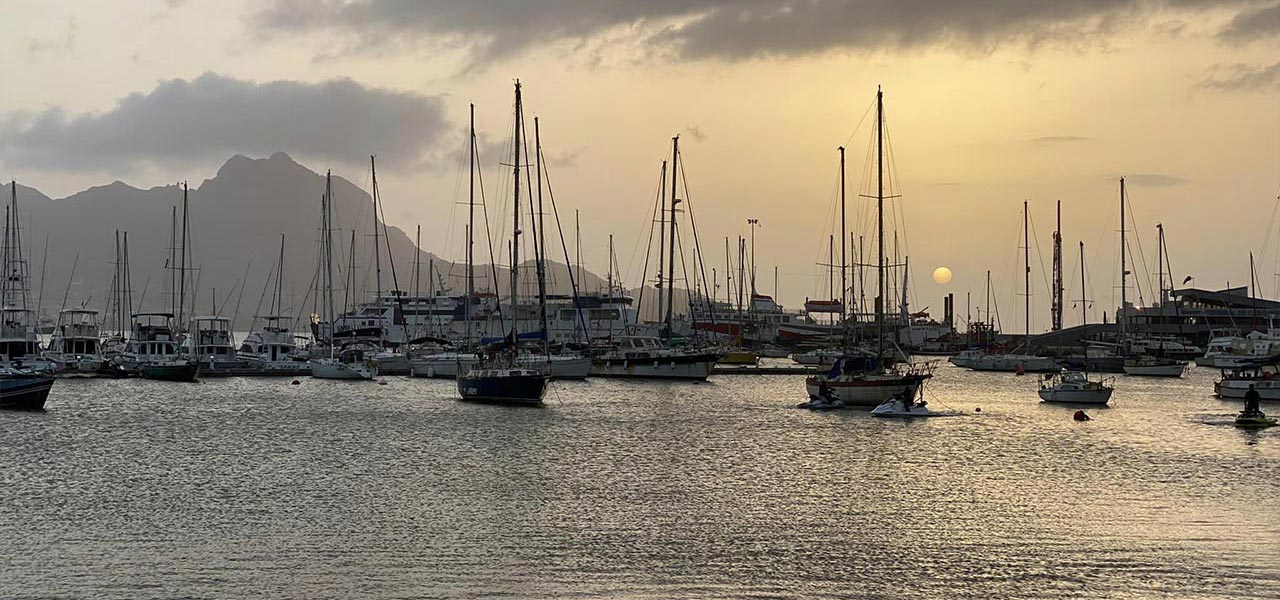
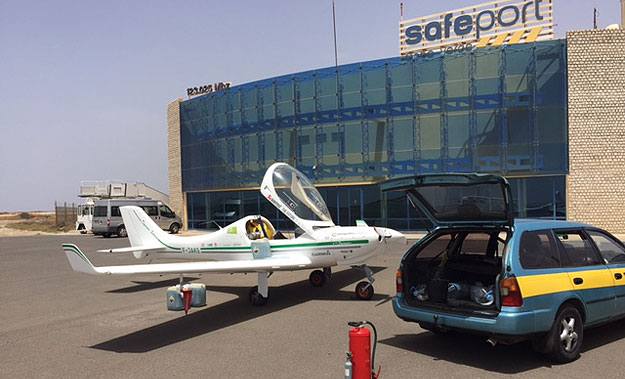
Cape Verde hosted an international research project JATAC organised by ESA - European Space Agency, with the participation of research institutions such as the US Space Agency (NASA), the Greek National Observatory in Athens (NOA) and the Slovenian University of Nova Gorica, where the head of the Center for Atmospheric Research is Dr. Griša Močnik. Based on many years of experience in atmospheric research in the GreenLight WorldFlight project the companies Aerovizija d.o.o. and Haze d.o.o also participated.
The project aims to study the atmospheric conditions in the transport of Saharan sand, black carbon and other particles across the Atlantic and the impact on the global climate.
The measurements will be used to calibrate the Aeolus satellite, which is designed to measure wind speed over the entire surface of the Earth.
WESTERN BALKAN 2022 - Sarajevo, Belgrade
glwf2022-balkans.worldgreenflight.com
Flight data:
- Date: January 13th 2022 to February 12nd 2022
- Distance: 2 600 km / 1 404 nm
- Flights: 12
- Average ground speed: 220 km / h / 119 kts
- Average flight altitude: 1000 m / 3300 ft
- Maximum flight altitude: 3000 m / 9850 ft
- Average fuel consumption: 20 liters / h
- The longest flight: 561 km / 303 nm
- Fuel Type: Mogas 95
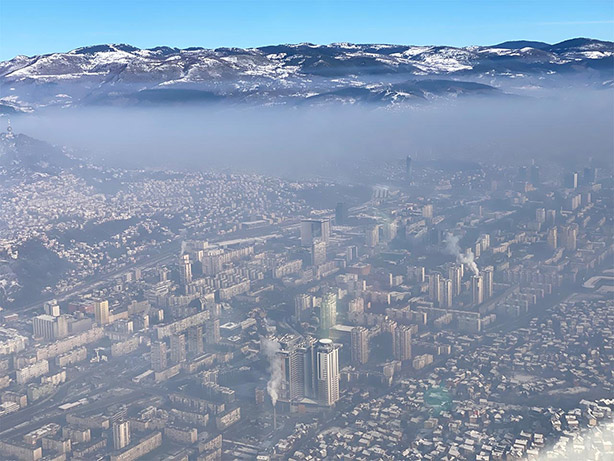
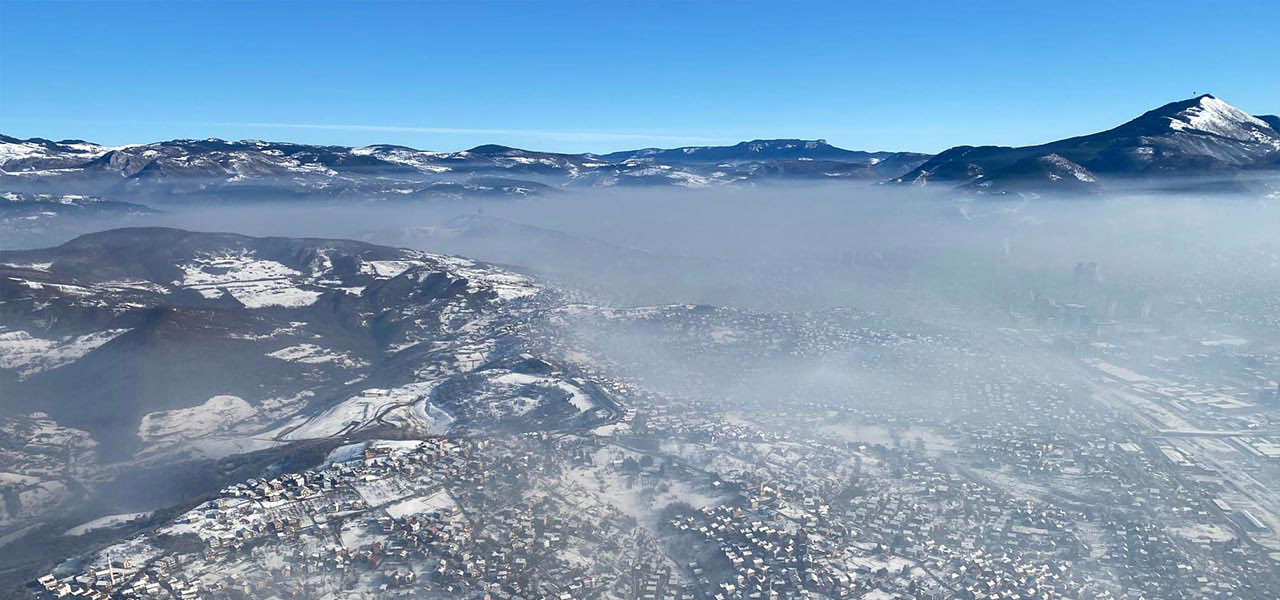
Sarajevo is the largest and capital city of Bosnia and Herzegovina and one of the most important cities in the Balkans. It lies in a basin along the Miljacka River in the eastern part of the country with more than 400,000 inhabitants. It is one of the cities with the most polluted air in the world. Air pollution levels are sometimes ten times higher than EU limits and even worse than those in Beijing, New Delhi and Mumbai. In order for the situation to change one day, measurements are extremely important. As measurements in the air will be combined with measurements on the ground, the data will be able to serve as a basis for comparing the state of the air after the measures taken
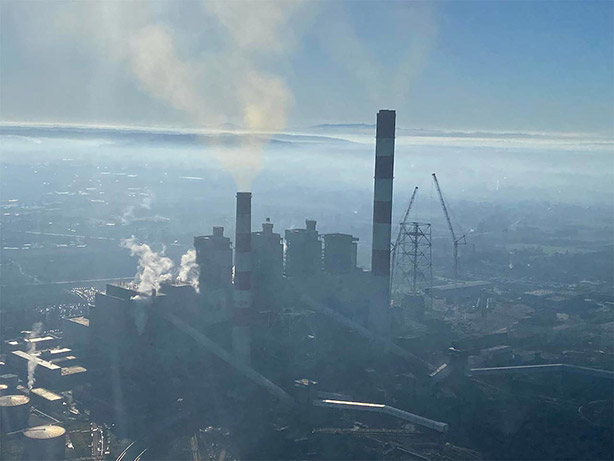
The causes of bad air in Belgrade are also similar to those in Sarajevo. About 400,000 old cars with "Euro 3" engines drive around the city, and as many as 800,000 such cars in the whole of Serbia. According to the official data of the Environmental Protection Agency, the majority (75 percent), of air pollution was caused by small heating stoves, which there are more in every city. Thermal power plants also make a huge contribution. Kostolac B, not far from Belgrade, has the most harmful discharges in the Balkans. For more than half of the days of the year, the air above Belgrade is otherwise stationary and does not carry the dirt anywhere. The majority of PM 2.5 particles and larger PM 10 solid particles remain in Serbia, the same is true over Bosnia and Herzegovina and other Balkan countries, as air currents are similar throughout the region.
JATAC 2021 - Cape Verde
jatac2021.worldgreenflight.com
Flight data:
- Date: September 4th 2021 to September 22nd 2021
- Distance: 15 100 km / 8 118 nm
- Flights: 15
- Average ground speed: 210 km / h / 113 kts
- Average flight altitude: 2,000 m / 56,560 ft
- Maximum flight altitude: 6000 m / 19,700 ft
- Average fuel consumption: 18.7 liters / h
- The longest flight: 2,354 km / 1266 nm
- Total flight over the ocean: 12,500 km / 6,720 nm
- Fuel Type: Mogas 95, Avgas 100LL
Cape Verde hosted an international research project J-ATAC organised by ESA - European Space Agency, with the participation of research institutions such as the US Space Agency (NASA), the French National Center for Scientific Research (CNRS), the German Aerospace Center (DLR), the Greek National Observatory in Athens (NOA) and the Slovenian University of Nova Gorica, where the head of the Center for Atmospheric Research is Dr. Griša Močnik. Based on many years of experience in atmospheric research in the GreenLight WorldFlight project the companies Aerovizija d.o.o. and Haze d.o.o also participated.
The project aims to study the atmospheric conditions in the transport of Saharan sand, black carbon and other particles across the Atlantic and the impact on the global climate.
The measurements will be used to calibrate the Aeolus satellite, which is designed to measure wind speed over the entire surface of the Earth.
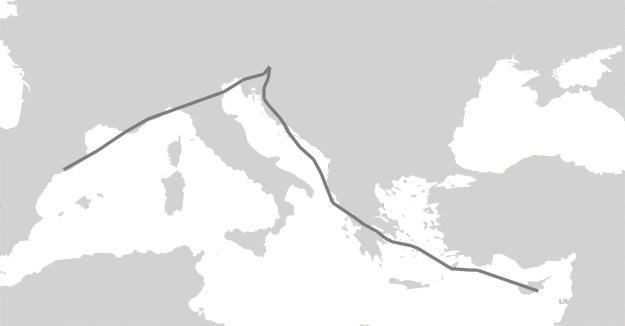
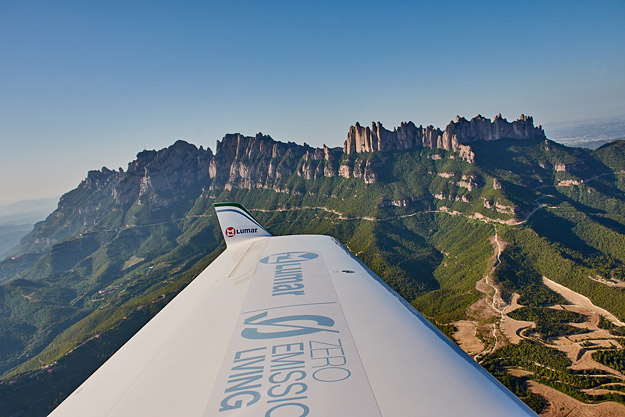
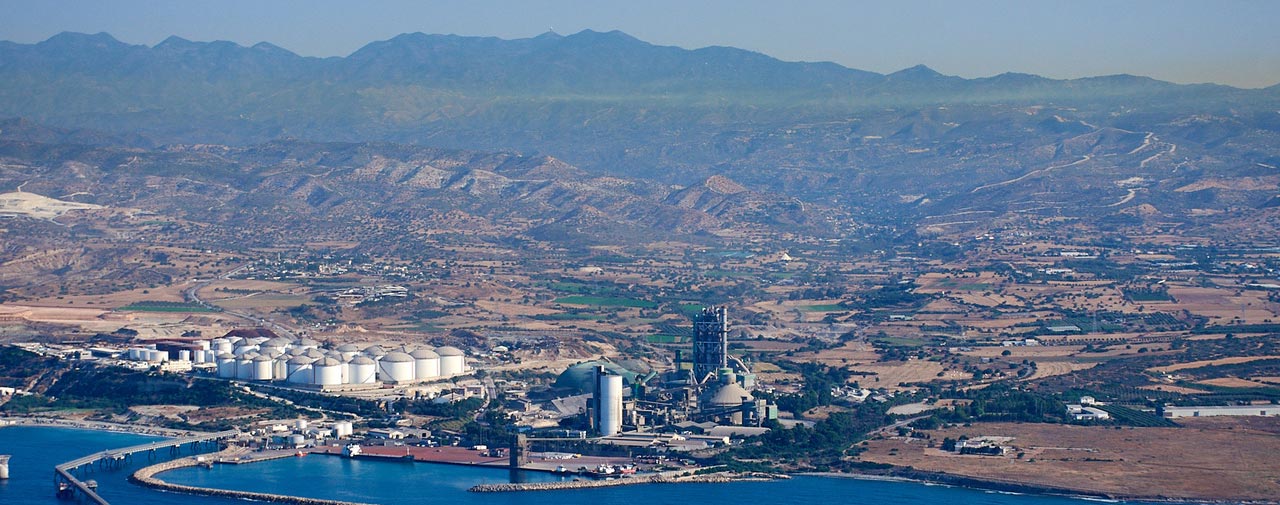
GLWF 2019 - Spain - Cyprus
Flight plan:
Slovenia, Italy, France, Spain, Croatia, Greece, Cyprus
Flight data:
- Date: June 21st 2019 to July 11th 2019
- Distance: 9,500 km / 5,126 nm
- Flights: 15
- Average ground speed: 233 km / h / 126 kts
- Average flight altitude: 1,524 m / 5,000 ft
- Maximum flight altitude: 4,328 m / 14,200 ft
- Average fuel consumption: 16.3 liters / h
- The longest flight: 1,393 km / 752 nm
- Total flight over the ocean: 2,500 km / 1,349 nm
- Fuel Type: Mogas 95, Avgas 100LL
GLWF 2019 spent summer months in Catalonia and Cyprus where partly join DNAAP (Detection of Non-Anthropogenic Air Pollution) campaign co-ordinated by Aerosol d.o.o. which was co-financed by RS and EU. We have been lucky with perfect condition to measure Sahara dust mixed with anthropogenic pollution like black carbon around Barcelona. Non-anthropogenic air pollution is extremely important as it has strong influence to the health of all living beings and speed up climate changes. We flew together with Domen Grauf as flying in complicated controlled airspaces with number of complicated instruments on board is a full time job for two pilots. Dr. Griša Močnik and dr. Luka Drinovec took care for scientific part of the project, designing, maintaining instruments, collecting data and preparing draft reports.
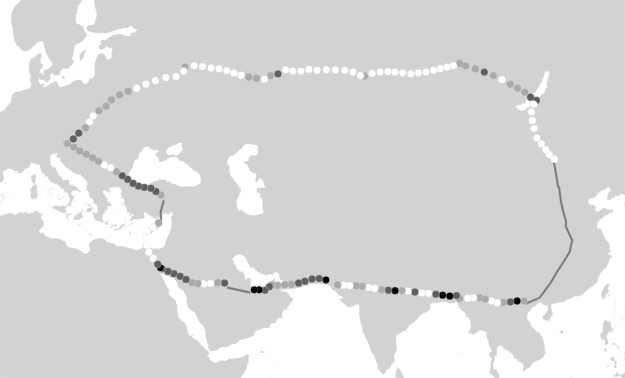
GLWF 2018 - ASIA 2018
Flight plan:
Slovenia, Croatia, Serbia, Bulgaria, Turkey, Cyprus, Egypt, Saudi Arabia United Arab Emirates, Oman, Pakistan, India, Bangladesh, Myanmar, Laos, Vietnam, China, Mongolia, Rusia, Belarus, Poland, Slovakia, Hungary.
Flight data:
- Date: April 9th 2018 to May 10th 2018
- Distance: 22,500 km / 12,141 nm
- Flights: 16
- Average ground speed: 220 km/h / 119 kts
- Average flight altitude: 3,048 m / 10,000 ft
- Maximum flight altitude: 4,602 m / 15,100 ft
- Average fuel consumption: 17 liters / h
- The longest flight: 2,587 km / 1,396 nm
- Total flight over the ocean: 2,100 km / 1,133 nm
- Fuel Type: Mogas 95, Avgas 100LL
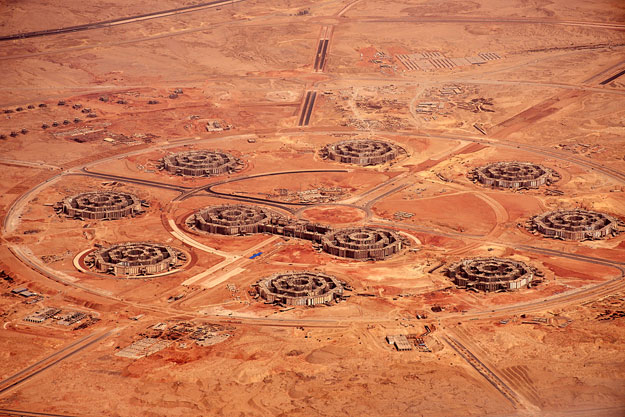
During the campaign GLWF 2018 we measured contributions from natural and anthropogenic sources. Desert dust, which is coarser, contributes significantly lower in the atmosphere. We have seen this especially over the Arabian Peninsula. It is noteworthy that also here very close to the ground anthropogenic combustion sources dominate. High in the atmosphere, products from fossil and biomass fuel combustion contribute most to the heating.
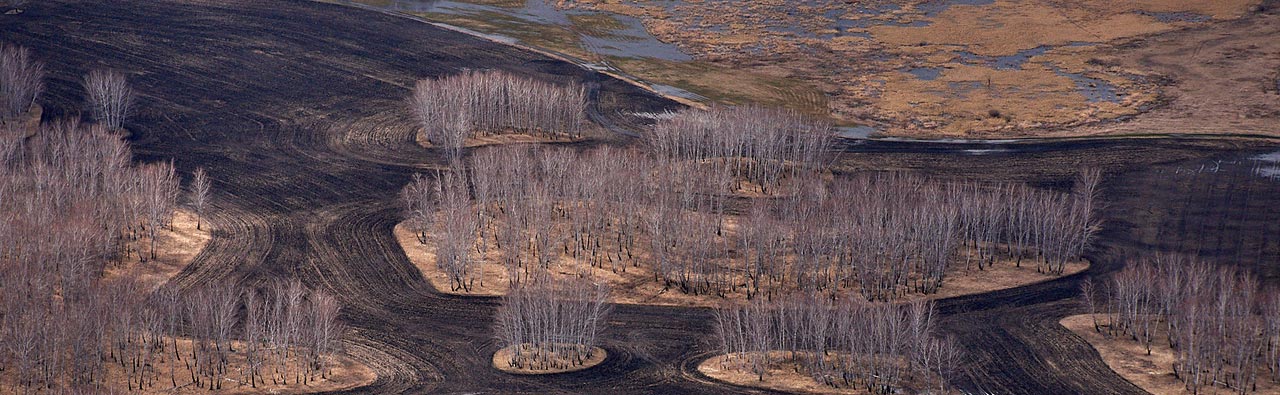
Concentrations of absorbing aerosols depend on the activity of the sources, dispersion in the atmosphere and the rate of deposition. Atmospheric mixing is very efficient over deserts and in the tropics due to large differences in temperature at night and during the day. Over Siberia, precipitation efficiently removed aerosols from the atmosphere despite forest fires over which the instrumented plane flew.
The influence of the emissions on the ground can reach high in the atmosphere and different sources influence the climate differently. This depends on the type of generated aerosols. This pollution is dispersed regionally depending on meteorological conditions, which are also responsible for the aerosol removal from the atmosphere. The influence of the sources may be regional, but usually local sources dominate.
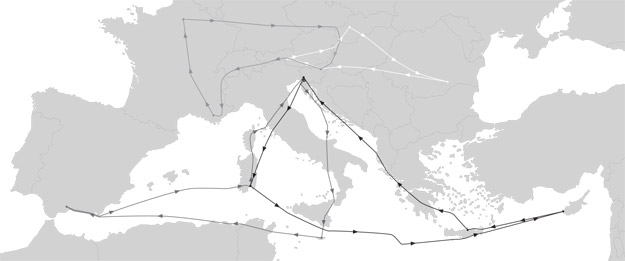
GLWF 2017 - Mediterranean
Flight plan:
Slovenia, Italy, Malta, Tunisia, Algeria, Spain, Libya, Greece, Cyprus, Albania, Serbia, Croatia, France, Slovakia, Austria, Czech Republic, Germany, Hungary, Romania
Flight data:
- Date: March 24th, 2017 – July 7th 2017
- Distance: 18 000 km
- Flights: 15
- Flight hours: 80
- Average ground speed: 121 kts
- Average flight altitude: 8 500 ft
- Maximum flight altitude: 14 000 ft
- True airspeed TAS: 132 kts
- Average fuel consumption: 16.5 l/h
- Best economy: 12 l/h
- Minimum fuel consumption at 14 000 ft: 12 l/h
- The longest flight: 2300 km
- Total flight over the ocean: 5 700 km
- Fuel type: Mogas 95, AVGAS 100LL
We have collected data on carbon black across the Mediterranean, from Cyprus to southern Spain, and we have observed the spreading of desert dust in the north all the way to Paris. Preliminary checks of the collected data have showed that not only does the Saharan dust spread along the Mediterranean and reach the Alps, but in right weather conditions it also reaches northern Europe, settles on snow and ice in the Alps and it increases airborne particle concentration.
Interestingly, the data show that the Saharan dust is mixed with black carbon. It must be investigated, how this affects climate and where the sources of air pollution with black carbon are. The answer to this question can be found through a detailed analysis and the combination of air and ground measurements that can differentiate between the Saharan dust and the small aerosols of black carbon, and that can determine their properties. Alongside air measurements, these measurements were performed in Cyprus in collaboration with the local scientists.
GLWF 2016 - World Flight
Flight plan
Italy, France, Spain, Morocco, Western Sahara, Mauritania, Cape Verde, Martinique, Virgin Islands, Puerto Rico, Turks and Caicos, Bahamas, Florida, Louisiana, Texas, New Mexico, Arizona, Nevada, California, Hawaii, Marshall
Islands, Micronesia, Guam, Philippines, Borneo, Malaysia, Thailand, Sri Lanka, India, Oman, United Arab Emirates,
Qatar, Bahrain, Saudi Arabia, Egypt, Greece, Albania, Montenegro, Croatia.
Flight data
- Date: January 8th 2012 to April 19th 2012 - 61 flying days
- Distance: 91003 km / 49 138 nm
- Flights: 60
- Flight hours: 369
- Average ground speed: 247 km / h / 133 kts
- Average flight altitude: 10,000 ft
- Maximum flight altitude: 8,965 m / 29,413 ft
- True airspeed TAS: 140-145 kts
- Average fuel consumption: 18.1 liters / h
- Best economy at 10,000 ft, TAS 133 kts: 16.7 liters / h
- Minimum fuel consumption at 4000 m: 16.5 l / h
- The longest flight: 3,593 km / 1,940 nm
- Total flight over the ocean: 33,100 km / 17,873 nm
- Fuel Type: Mogas 91, 93, 95 octane, AVGAS 100 LL AVGAS 100-130
We encountered new areas with extremely high black carbon concentrations above parts of the developed world, such as the Gulf of Mexico coast. Measured concentrations indicate that the pollution above this area is most probably caused by oil extraction and refining. Industrial emissions and air pollution from this source were successfully reduced in Europe, and this is one of the greater achievements in decreasing environmental pollution. Therefore, we tend to forget that industry can be an important source of pollution in the developed world.
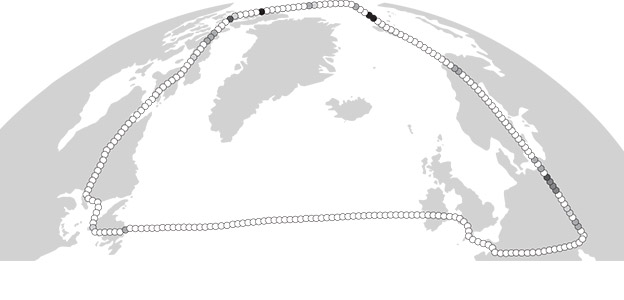
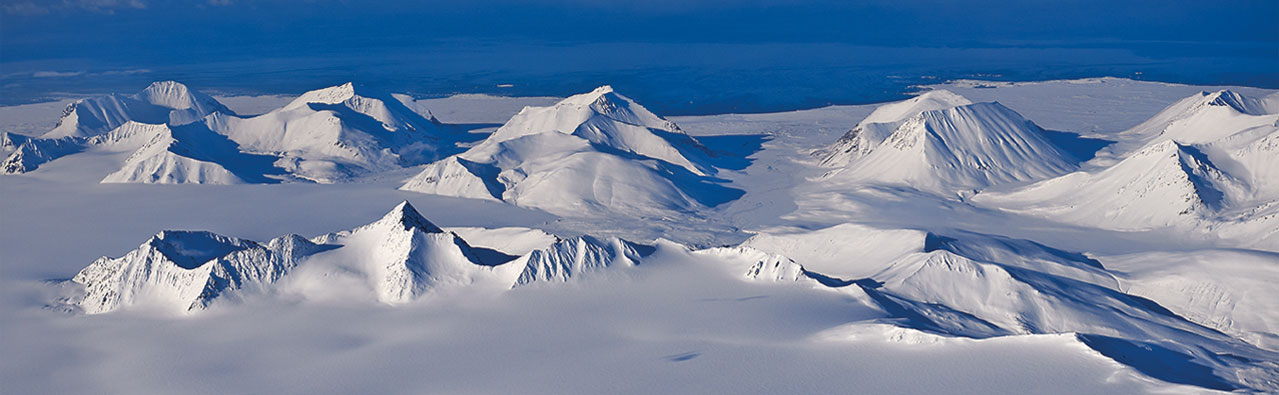
GLWF 2013 - North Pole
Flight plan:
Austria, Czech Republic, Germany, Sweden, Norway, Canada, Ireland, England, France, Italy
Flight data:
- Date: April 22nd 2013 to May 26th 2013 - 11 flying days
- Distance: 17,050 km / 9,206 nm
- Flights: 11
- Flight hours: 61
- Average ground speed: 278 km / h / 150 kts
- Average flight altitude: 10,000 ft
- True airspeed TAS: 130-145 kts
- Average fuel consumption: 17 liters / h
- Best economy at 10,000 ft, TAS 133 kts: 16.7 liters / h
- Minimum fuel consumption at 4000 m: 16.5 l / h
- The longest flight: 3,189 km / 1,722 nm
- Total flight over the ocean: 6,500 km / 3,510 nm
- Fuel Type: Mogas 91, 93, 95 octane, AVGAS 100 LL
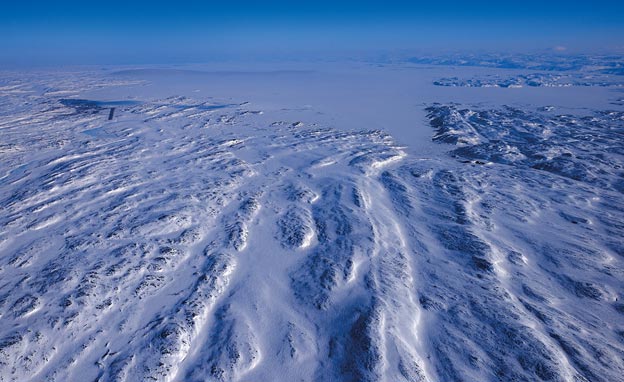
Black carbon concentrations above the Arctic were very low as we anticipated, since the areas are far from all sources of pollution. We nevertheless identified a well-defined area of pollution during the flight to the North Pole. The concentrations increased up to the values expected on the ground in cities. The calculated back-trajectories show the source of this black carbon are industrial activities around Norilsk, and oil extraction and refining. Oil extraction is accompanied by flaring, and this is the largest source of black carbon pollution above the Arctic.
GLWF 2012 - World Flight
Flight plan:
Italy, France, Spain, Morocco, Western Sahara, Mauritania, Senegal, Brazil, French Guiana, Suriname, Puerto Rico, the Caribbean, Florida, Alabama, Mississippi, Louisiana, Texas, California, Mexico, Guatemala, El Salvador, Nicaragua, Costa Rica, Panama , Ecuador, Peru, Argentina, Chile, Antarctica, French Polynesia, New Zealand, Australia, Indonesia, Malaysia, Thailand, Myanmar, Bangladesh, Nepal, India, Seychelles, Tanzania, Mozambique, South Africa, Namibia, Angola, Congo, Central African Republic , Chad, Niger, Libya, Tunisia.
Flight data:
- Date: January 8th 2012 to April 19th 2012 - 61 flying days
- Distance: 91003 km / 49 138 nm
- Flights: 60
- Flight hours: 369
- Average ground speed: 247 km / h / 133 kts
- Average flight altitude: 10,000 ft
- Maximum flight altitude: 8,965 m / 29,413 ft
- True airspeed TAS: 140-145 kts
- Average fuel consumption: 18.1 liters / h
- Best economy at 10,000 ft, TAS 133 kts: 16.7 liters / h
- Minimum fuel consumption at 4000 m: 16.5 l / h
- The longest flight: 3,593 km / 1,940 nm
- Total flight over the ocean: 33,100 km / 17,873 nm
- Fuel Type: Mogas 91, 93, 95 octane, AVGAS 100 LL AVGAS 100-130
The GLWF 2012 flight concluded very successfully, as we gathered a vast amount of data. We pushed our instruments to their limits – we were measuring concentrations from a few ng/m. (ng/m. is nanogram per cubic meter, a billionth of a gram of black carbon in one cubic meter of air) above oceans to several thousand ng/m. above inhabited areas. Some high concentrations of black carbon were in certain cases probably a consequence of slash-and-burn agricultural techniques, for example above Malaysia and the Congo River. We measured increased black carbon concentrations above South-East Asia, with an extremely interesting event above the Thailand-Myanmar border where we measured a big increase in concentrations.
- Green partner

- Scientific partners


- Technical partner


- Media partner